integration-dashboard
Your layout.
Your style.
Your extensions.
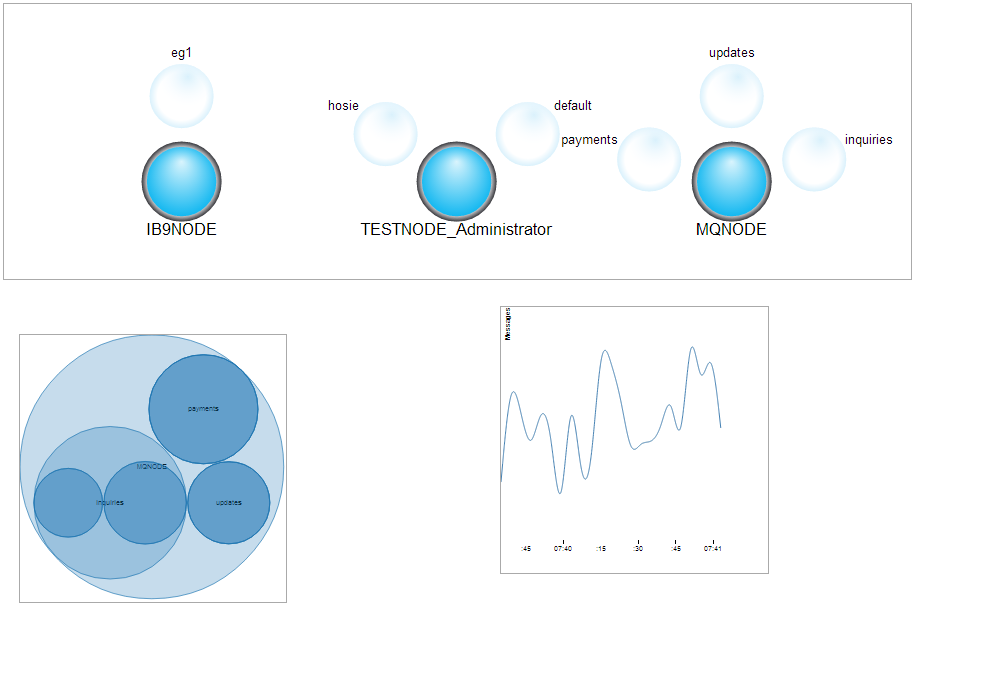
Integration dashboard is your view to your integration bus. Designed to be used with IBM Integration Bus and to give you live visualisation of the activity across multiple integration nodes.
Layout
With simple drag'n'drop actions, you chose which aspects of the activity to visualise. There ae widgets for:
- CPU usage across flows, applications, integration servers
- Connector activity charts and logs
- Message through-put
- and many more to come
Style
With a little knowledge of css, you can control the style of the dashboard and widgets.
Extend
If you fancy rolling your sleves up and playing with cool, data visualisation, technology like D3, you can extend the dashboard with your own widgets. Javascript framework makes it easy with common utilities to exploit IIB stats, D3, JQuery UI and SVG.